The Economics of Operating Teams: Making the ROI Case to Senior Partners Skeptical of the Investment
The hardest sell in private equity isn’t to LPs—it’s to your own partnership. While LPs increasingly view sophisticated operating capabilities as table stakes, many senior partners remain skeptical about redirecting 5–20% of management fees toward operating teams. The resistance is visceral: deal partners who built their careers on transactional success see operating resources as cost centers, not investments.
This skepticism is the biggest barrier to building competitive operating capabilities. Firms lose deals to operationally advanced rivals, watch portfolios underperform, and face tougher LP conversations—yet internal debates still revolve around whether the firm can “afford” operating partners. The framing is the problem. Operating teams aren’t expenses to minimize—they’re the highest-return investments most PE firms can make today.
The math is clear: firms with mature operating capabilities generate 2–3 percentage points higher IRR. On a $2 billion fund, that’s $120–240 million in additional value. The cost? Around $40–80 million across the fund’s life. That’s a 2–3x return on investment—before factoring in gains in fundraising, deal flow, and talent attraction. Few internal investments rival that payoff.
Still, the data rarely changes minds. Overcoming skepticism requires a shift in perspective: from cost to value, from partner-level economics to firm-level competitiveness, from zero-sum thinking to long-term advantage. This article outlines the financial logic and strategic framing needed to build alignment—and unlock the operating capabilities that increasingly define winning firms.
The Real Cost of Operating Teams Across Fund Sizes
To evaluate the true cost of operating teams, firms must look beyond topline numbers—considering compensation by seniority, team size by fund scale, and overall percentage of management fee allocation. While figures vary, clear patterns help benchmark investment expectations.
Individual Compensation:
- Associates earn $200K–$300K total cash. Most lack carry, though 10–17% now receive modest allocations, reflecting growing industry alignment incentives.
- Vice Presidents average $340K–$470K, with 29–54% eligible for carry. At large funds, total packages reach ~$600K, with carry worth $1.1M–$2.9M at 2x return.
- Principals/Directors bring in $500K–$750K, with 57–79% carry eligibility worth $2M–$2.8M, reaching $8M at upper quartile. These are seasoned transformation leaders.
- Operating Partners/MDs earn $750K–$1.6M in cash, with carry reaching $3M–$8M—and up to $23.6M at mega-funds. PE experience is increasingly non-negotiable at this level.
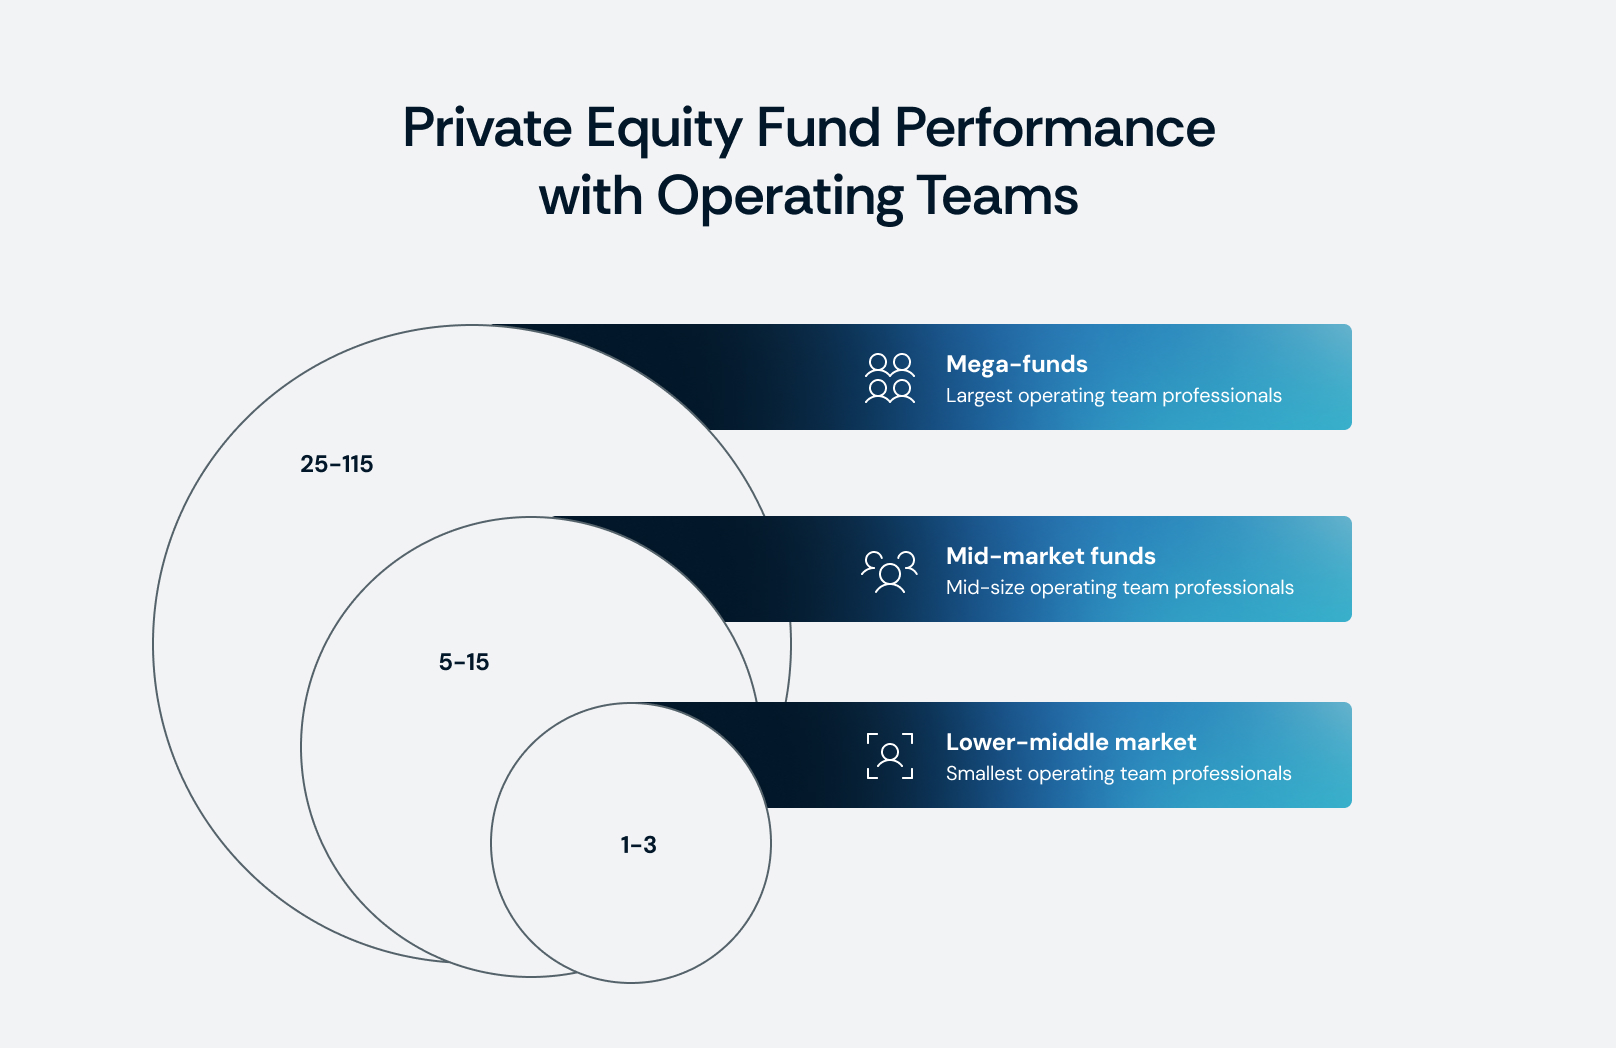
Team Size by Fund Scale:
- Lower-middle market funds ($250M–$1B) typically staff 1–3 operating pros, spending $500K–$2M annually (10–20% of fees).
- Mid-market funds ($1B–$5B) field 5–15 pros, spending $5M–$15M (8–15% of fees). Charles Aris data shows higher investment correlates with stronger fund performance.
- Mega-funds (>$5B) build institutional teams—25–115 professionals. KKR’s Capstone, Bain Capital, and Blackstone serve hundreds of portfolio companies. These teams cost $25M–$50M annually but represent just 5–10% of massive management fee pools.
The Fee Allocation Challenge:
This is where resistance sharpens. Operating teams require 10–20% of the management fee pool, directly reducing partner take-home. At a $2B fund charging 2%, a $40M annual fee pool shrinks to $32M if $8M goes to operations—cutting each of 10 partners’ cash compensation by 20%. This zero-sum framing drives political friction—even when the ROI is clear.
Understanding the Hierarchy: Operating Role Trade-offs
Building an effective operating team isn’t just about budget—it’s about strategic composition. Each role within the team brings unique strengths and limitations. Here’s how they compare:
Associate / Vice President ($200K–$470K):
- Strengths: Cost-effective, analytically strong, skilled in modeling and dashboarding
- Limitations: Lacks C-suite credibility; needs senior oversight; limited strategic pattern recognition
- Best Use: Portfolio analytics, KPI tracking, recruiting pipelines, and supporting execution under senior guidance
Principal / Director ($500K–$750K):
- Strengths: Functional leadership trust, execution ownership, real operating experience
- Limitations: Still limited CEO/Board influence; narrow deal diligence experience
- Best Use: Owning cost-out or process redesign workstreams, translating analysis into action
Operating Partner / Managing Director ($750K–$1.6M+):
- Strengths: Instant CEO/CFO/Board trust, deep pattern recognition, end-to-end capability from diligence through exit
- Limitations: High cost—but typically delivers 10x–30x ROI via increased portfolio enterprise value
- Best Use: Deal diligence and investment committee participation, C-level engagement, operational transformations, and crisis management
Understanding the Full Cost Picture
Beyond salaries and bonuses, there’s a 15–25% overhead premium that covers essentials like office space, travel, technology, recruiting, training, and admin support. For example, a $10M salary budget equals ~$11.5M–$12.5M fully loaded.
External resources add another layer of cost—but also value. Mega-funds routinely spend $5–$10M annually on consultants, executive search, and implementation partners. Mid-market firms spend $2–$5M. These costs aren’t alternatives to internal teams—they’re force multipliers.
Total Investment Required:
- Mid-market firms: 12–20% of management fees
- Mega-funds: 8–15% of management fees
A $1B fund (with $20M in annual fees) might invest $2.4M–$4M per year—$19.2M–$32M over an 8-year cycle. A $5B fund (with $75M in fees) invests $9M–$15M annually—up to $120M over fund life.
The cost is significant. But so is the ROI—data shows operating teams deliver results that far outstrip their cost, especially when measured against increased IRR, portfolio company performance, and competitive positioning.
Quantifying the Return: How IRR Gains Translate to Hundreds of Millions
The performance gap between firms with strong operating teams and those without has been measured repeatedly across thousands of deals: firms with robust operating capabilities generate 2–3 percentage points higher IRR. That difference, while modest on paper, compounds into hundreds of millions at the fund level.
The Simple ROI Formula
At its core, the math is straightforward:
ROI = Total Enterprise Value (TEV) Uplift ÷ Investment in the Operating Role
Even small EBITDA improvements create outsized value when multiplied across a portfolio:
- $1M incremental EBITDA × 10x multiple = $10M TEV uplift
- $5M incremental EBITDA × 10x multiple = $50M TEV uplift
- $10M incremental EBITDA × 10x multiple = $100M TEV uplift
These gains come from two primary pathways:
- Revenue growth: $5M incremental revenue at 20% margin = $1M EBITDA = $10M TEV uplift (via pricing optimization, sales effectiveness, GTM improvements).
- Cost efficiencies: $1M in savings = $10M TEV uplift (via procurement, operational efficiency, margin expansion).
Against senior operating partner comp of $750K–$1.5M annually, the math delivers 10–30x returns within the first 12–18 months.
The Fund-Level Impact
McKinsey’s analysis of 100+ post-2020 PE funds confirms the 2–3% IRR advantage. Scaled up:
- $2B fund at 15% IRR (2.5x MOIC): Returns $5B.
- At 17% IRR (2.8x MOIC): Returns $5.6B (+$600M). Carry on that = $120M for partners.
- At 18% IRR (3.0x MOIC): Returns $6B (+$1B). Carry = $200M for partners.
With operating team costs of $40–80M per fund, the ROI ranges 2.5x–5.0x—returns no marketing budget or incremental deal hire can match.
The ROI Case Works from Every Perspective
The payoff from operating teams isn’t theoretical—it’s measurable across GP economics, LP outcomes, and portfolio company performance.
From the GP perspective:
Operating team investment delivers 2.5–5.0x ROI when measured as incremental carry versus fully loaded operating costs. A 2–3% IRR lift translates into hundreds of millions in additional value for a $2B fund, with $120–200M flowing directly to GP carry. Even after factoring in compensation, carry allocations, overhead, and external advisors, no other use of management fees delivers comparable returns.
From the LP perspective:
Sophisticated LPs now measure ROI as 10–30x annual returns—portfolio value created versus annual team cost. When operating partners drive $5–10M EBITDA gains across a portfolio (worth $50–100M at exit) against $1–3M annual cost, the case becomes undeniable. LPs increasingly treat operating capabilities as mandatory, not optional, in allocation decisions.
Across fund sizes:
The math holds regardless of scale:
- $500M fund: $30–60M in extra carry on $15–25M in costs = 2–3x ROI.
- $10B fund: $600M–$1B in extra carry on $80–150M in costs = 4–10x ROI.
Larger funds benefit most in absolute dollars, but percentage ROI remains consistently compelling.
At the portfolio company level:
- Cambridge Associates’ study of 1,700 deals shows firms with >11% EBITDA growth generated outsized returns; >20% growth correlated with 50% of deals achieving 3.0x+ MOIC.
- MSCI research (2022–2024) confirms margin expansion of 0.2–1.5 points at successful exits versus margin deterioration of 1.2–1.4 points in underperformers. Even a 2-point margin gain on a $100M revenue company creates $20M TEV uplift—$200M across a 10-company portfolio.
- PwC finds operating partner involvement cuts deal failure rates by ~30%. On a $2B fund, avoiding one $100M loss adds nearly a full IRR point.
The time value effect:
Median holds now exceed 5.7 years. Flat EBITDA destroys returns, but 15% EBITDA growth doubles by year five and 2.5x by year seven. Operating teams accelerate this trajectory—and critically, shorten hold periods. PwC found operationally sophisticated firms exited 6–18 months faster, adding 50–100 bps of IRR.
The structural shift:
Bain & Company confirms operations now drive 47% of PE value creation, eclipsing both leverage (25%) and multiple expansion (28%). The old playbook is dead. Without operating capabilities, firms simply can’t deliver competitive returns.
The takeaway:
From GP carry to LP allocation, from faster exits to lower failure rates, the ROI case is overwhelming. Operating teams don’t redistribute value—they expand the pool, reduce downside risk, and accelerate outcomes. For partnerships still treating operations as “optional,” the math makes clear: the cost of inaction is far higher than the cost of investment.
The Fundraising Advantage Compounds Across Cycles
The case for operating teams extends well beyond portfolio performance—it determines fundraising success. In today’s market, where there is just $1 of LP capital for every $3 of GP demand, operational sophistication is no longer an advantage; it’s survival.
Capital flows to operational leaders.
Median time to close has stretched to 18.1 months, with first-time funds often failing to raise at all. Meanwhile, the top six firms—Blackstone, KKR, Apollo, Carlyle, TPG, and Blue Owl—captured nearly 60% of 2024 fundraising, up from 20% in 2019. The common thread: institutionalized operating platforms. KKR’s 100+ person Capstone team, Blackstone’s group serving 250+ companies, Bain Capital’s 115-person Portfolio Group. The correlation between operating depth and fundraising success is near-perfect.
LP priorities have shifted.
Operational value creation now ranks as the #1 factor in manager selection (Russell Reynolds). LPs probe deeply into evidence: quantified EBITDA gains, OP involvement in exits, org charts, comp structures with carry alignment, and KPI systems. One LP put it plainly: “We used to accept financial engineering. Now we see transaction skills as commoditized. What separates managers is execution.”
Distribution pressure raises the bar.
Distributions to LPs dropped to 14.6% of NAV in 2022—near crisis levels. Unrealized PE value doubled to $2.5T by 2023. In this environment, LPs favor managers who can generate cash returns through operational exits. Operating teams deliver cleaner financials, stronger management continuity, and EBITDA improvements that drive premium multiples.
Fundraising speed compounds advantage.
Operationally sophisticated firms close funds in 12–14 months versus 18–24 for peers. That six-to-twelve month advantage allows faster deployment, better market timing, and compounding advantage over multiple fund cycles.
Terms, re-ups, and reputation follow.
- LPs increasingly set operating capability requirements in fund terms. Firms with established platforms negotiate from strength; others scramble to retrofit capabilities.
- Top-quartile funds with robust ops teams see 90%+ LP re-up rates; weaker firms see 60–75%, forcing costly new LP acquisition campaigns.
- LP memory is long. Firms that overpromised and underdelivered operationally face reputational scars lasting years. Word-of-mouth in LP networks spreads fast, amplifying both strengths and weaknesses.
The economics are undeniable.
A $2B fund raised in 14 months at full fees versus a $1.5B fund raised in 20 months with reduced fees means an $80M difference in management fees alone over fund life—capital that can be reinvested into operating scale, further widening the gap.
Deal Sourcing and Competitive Positioning Beyond Returns
Operating teams don’t just improve portfolio performance—they reshape how firms win deals, attract talent, and position themselves competitively in the market. These advantages justify the investment in operating capabilities even before accounting for direct IRR impact.
Proprietary Deal Flow
Founders and family-owned sellers increasingly prefer buyers who provide operational support, not just capital. Bringing operating partners into management presentations, showcasing specific resources (tech support, procurement programs, talent development), and referencing past success differentiates firms in tight auctions.
- McKinsey research shows proprietary deals trade at 0.5–1.0x lower EBITDA multiples—5–8% cheaper than auctioned assets. On a $100M EBITDA deal, that’s $50–100M in savings, directly boosting MOIC.
- Capturing even 20–30% of deals as proprietary can add 50–75 bps to fund-level IRR.
Winning Auctions Without the Highest Bid
In competitive processes where bids cluster within 5–10%, sellers and management teams often choose partners they trust to execute post-close. Operating partners provide that credibility. Case studies show sellers accepting slightly lower valuations for buyers with demonstrated operational support.
Management Talent Advantage
The best executives want to work with firms that provide operational backing, not oversight alone. CEO candidates now ask: Does the firm have operating partners? What expertise do they bring? Are they empowered to help?
- Firms with formal talent functions fill executive roles 40% faster than peers relying solely on search firms.
- Those placements experience 25% lower turnover in the first two years.
This “talent flywheel” compounds as networks of proven leaders circulate across portfolios.
Serial Entrepreneur Pipeline
Founders who sell to operationally strong PE firms often return with their next ventures. Vista Equity, for example, has built repeat deal flow from software founders who valued its operational playbooks. These “repeat customer” deals often come at more favorable valuations because entrepreneurs prioritize partnership quality.
Reputation and Industry Positioning
Operating partners who consistently deliver become known in their sectors. Successful portfolio outcomes build reputational equity, attracting inbound deal flow and making the firm a “preferred partner” in banker and entrepreneur networks.
Club Deals and Co-Investments
In consortium deals, firms with credible operating teams often lead execution—gaining disproportionate influence and carry relative to capital contributed. Institutional co-investors also seek out operators to anchor syndicates, creating further access advantages.
Competing Against Strategics
Corporates often outbid PE firms on price, but PE firms with strong operating models win by promising independence and dedicated support. Strategics tend to integrate acquisitions; operating partners make credible the claim that PE will help companies flourish as standalone platforms.
Exit Positioning
At exit, operating partners help portfolio companies present as “exit ready”: clean reporting, scalable systems, strengthened management, and a clear operational equity story. This preparation drives more competitive buyer interest, better pricing, and smoother processes.
Portfolio-Wide Scale Benefits
Mega-funds demonstrate the power of scale-enabled operating programs:
- KKR: $700M+ in cross-portfolio procurement savings
- Blackstone: $600M+ in portfolio-wide cost reductions
- Vista: standardized AI playbooks and shared digital infrastructure
These initiatives are impossible to replicate without substantial operating infrastructure—and they compound with fund size.
Why the Investment Decision is Binary, Not Incremental
Operating capabilities aren’t something you can “test.” Either a firm invests enough to build a true engine of value creation, or it creates a cosmetic program that satisfies neither LPs nor portfolio companies while draining resources. The middle ground—hiring one or two underpowered operators without integration, authority, or carry—produces dysfunction and accelerates talent attrition.
Threshold for Effectiveness
Real operating teams require critical mass:
- Scale: enough people to go deep with portfolio companies, not just skim at board level.
- Seniority: leaders respected by CEOs and trusted by deal partners.
- Breadth: functional and sector coverage aligned to portfolio needs.
- Integration: equal seat at the table with deal teams, including IC participation.
- Incentives: meaningful carry that signals operating partners are true partners, not support staff.
Fall short in any one dimension, and the entire capability collapses.
The Cost of Half-Measures
Consider a $1B mid-market fund that “tests” the model with one part-time OP on a $200K retainer and no carry. That individual can’t cover 10–15 portfolio companies, lacks authority, and is quickly marginalized by CEOs and deal teams. Within 18 months they leave, the firm is out $300–400K, and the experiment convinces skeptical partners that “operations doesn’t work.”
Cultural Integration is Binary Too
Operating partners either sit inside IC, shaping deal theses and vetoing unsound assumptions—or they’re sidelined until post-close, forced to inherit impossible value-creation plans. One path builds credibility and drives returns; the other erodes both.
Organizational Models Must Match Strategy
- Generalist funds: centralized teams that capture cross-portfolio learning.
- Sector specialists (Vista, EQT, Permira): embedded OPs with deep industry expertise.
- The muddled middle: unclear roles, reporting confusion, and wasted investment.
Compensation Sends the Signal
Operators either receive partner-level economics—competitive salary, meaningful bonus, and real carry—or they’re consultants. Giving them “partner” titles but second-tier pay breeds resentment and drives top talent to competitors.
Leadership Commitment is Non-Negotiable
Senior partners must personally champion operating teams—defending budgets, resolving conflicts with deal teams, and making operating excellence as celebrated as sourcing. Without that visible buy-in, “ops” becomes a slide on an org chart, not a core capability.
Timeline and Scale Economics
It takes 2–3 years to recruit talent, build playbooks, and prove impact. Real ROI shows up only after a full fund cycle. And scale matters:
- 3-person team ($2–3M/year): board-level guidance only.
- 10-person team ($8–12M/year): functional depth, hands-on transformation, proprietary methodologies, and LP credibility.
The incremental $6–9M is the difference between advisory noise and transformational capability.
External Resources Are Multipliers, Not Substitutes
Strong internal teams leverage external consultants for targeted depth. Weak teams try to outsource operating capability wholesale—producing expensive PowerPoint that no one owns or implements.
The Internal Selling Campaign: Concrete Tactics for Overcoming Partner Resistance
Winning over skeptical partners requires more than numbers—it takes a systematic campaign that blends data, competitive intelligence, proof points, and cultural reframing. The goal isn’t to argue that operating capabilities are nice-to-have; it’s to make clear that they are essential for survival.
Phase 1: Establish Strategic Necessity (Months 1–3)
Start with external validation. Commission McKinsey, Bain, PwC, or a specialized PE consultancy to analyze the firm’s historic value creation versus peers. Quantify how much of past performance came from deal selection versus operational improvements, where the firm lags competitors on metrics like revenue growth or margin expansion, and what future returns look like under the current model. External benchmarks carry more credibility than internal advocates.
Add competitive intelligence. Show how Vista maintains a 1:1 ratio of operating to deal professionals, KKR’s Capstone has 100+ staff delivering $700M in procurement savings, Bain Capital fields 115 ops professionals, and Apollo embeds operators across the platform. Tie this to fundraising outcomes—faster closes, higher re-up rates, larger funds—and to specific deals the firm lost because competitors’ operational edge won the day.
Frame the conversation around three defensible questions:
- Are we falling behind peers that invested in operations?
- Are LPs demanding capabilities we don’t have?
- Can we reliably hit target returns without operational excellence?
This makes the investment a defensive necessity, not a discretionary upgrade.
Phase 2: Build Proof of Concept (Months 4–9)
Don’t push for a 20-person team on day one. Instead, launch a pilot on 2–3 portfolio companies with clear, quantified goals: expand margins by 300 bps in 18 months, accelerate revenue growth from 8% to 15%, or free $5M in working capital.
Hire or contract senior operating partners, but tie compensation to performance—base plus bonus plus carry linked directly to those companies. Track progress rigorously, report quarterly, and capture portfolio CEO testimonials. When a $400K operating partner drives $3M in incremental EBITDA, generating $30M in TEV at exit, the ROI speaks louder than any argument.
Phase 3: Scale Strategically (Months 10–18)
With pilot results in hand, present a financial model:
- Show how redirecting 10–15% of management fees reduces partner cash comp modestly in years 1–3 but grows total carry 2–3x over the fund life.
- Demonstrate a crossover point where partners earn more, not less, by supporting operations.
Establish governance: an Operating Committee with partner oversight, clear decision rights between ops and deal teams, and transparent compensation models aligning ops incentives with fund performance. Address talent sourcing concerns with candidate slates from Russell Reynolds, Heidrick & Struggles, and SCI to prove the talent is out there if the role is real.
Phase 4: Institutionalize and Integrate (Months 19–36)
Shift from initiative to identity. Require ops leaders in every IC, feature them prominently in LP decks, celebrate operational wins alongside deal closings, and include them in firm offsites and succession planning. Institutionalize best practices with standardized diligence checklists, 100-day playbooks, KPI dashboards, and quarterly value creation reviews.
Vista took a decade to embed operations into its DNA; expect 2–3 years just to move from pilot to permanence.
Handling Partner Objections
- “We can’t afford the hit to cash comp”: Show that reduced cash is offset by 2–3x higher carry over fund life.
- “Ops don’t drive returns”: Present deal-by-deal attribution, plus Cambridge data showing stagnant EBITDA equals subpar returns regardless of entry multiple.
- “We’ll just hire consultants”: Prove that external firms cost 2–3x more and lack accountability—leaving PowerPoints no one implements.
- “Our deal teams can do this”: Ask if partners want to run procurement projects instead of sourcing deals. Bandwidth is finite.
- “Good CEOs don’t need us”: Remind them 70% of PE-backed CEOs are replaced during the hold period. Even strong ones benefit from support.
- “We can’t find qualified operators”: Show active candidate pipelines. The barrier is not supply but offering second-tier roles and pay.
- “Ops will interfere with management”: Define roles clearly—support, not control. Cite examples where OPs enhanced rather than replaced management.
- “That’s for mega-funds, not us”: Point to EQT, Permira, and mid-market firms with tailored but equally effective operating models.
Why Waiting Guarantees Permanent Disadvantage
Delaying operating team investment until “the right time” is not a neutral choice—it’s a decision to accept permanent competitive disadvantage. The structural market shift toward operations-driven value creation is irreversible. Every quarter of delay compounds disadvantages across talent, deal flow, LP relationships, and portfolio performance.
Talent slips away. The best operating partners are already employed at sophisticated firms, building wealth and track records. When they move, they choose platforms with scale, clarity of role, and carry participation. Firms that hesitate face a shallower pool, higher compensation demands, and the risk of settling for second-tier operators who can’t deliver transformational results.
Deal flow bifurcates. Sellers and intermediaries increasingly prefer buyers with proven operational support. Those firms win proprietary deals and secure management’s trust in auctions. Late adopters get relegated to competitive processes where price, not partnership, determines the outcome. That 0.5–1.0x multiple disadvantage compounds into 50–75 basis points of IRR erosion per fund cycle.
LPs move on. Limited partners evaluating commitments today are assessing whether GPs have credible, scaled operating teams. A firm that starts building in 2025 won’t show measurable results until exits a decade later. By then, LPs will have reallocated capital to managers with proven operational capabilities. The “we’re building now” story won’t buy another two funds’ worth of patience.
Performance gaps widen irreversibly. Sophisticated firms are compounding 2–3 percentage point IRR advantages every cycle. They’re institutionalizing playbooks, recruiting stronger management teams, and building operating knowledge that doesn’t transfer to laggards. Without intervention, today’s gap becomes 4–5 points within a decade—an unbridgeable chasm.
Technology won’t wait. AI and digital transformation are delivering 5–25% EBITDA gains now. Firms embedding technical operators today are helping portfolio companies leap ahead. Those that delay until “the AI story matures” will inherit companies already disadvantaged against digital-first competitors. No level of financial engineering can offset structural technology deficits.
Costs escalate with delay. Compensation for top operators is rising fast. A senior OP at $750K cash and 2% carry today could command $1M+ and 3% carry in three years—and still be unavailable if locked in elsewhere. Early movers lock talent on favorable terms; laggards pay premiums or lose out entirely.
Cultural change gets harder. Operating integration requires senior buy-in, altered decision rights, and adjusted compensation. Resistance grows as traditional models deepen their hold. Firms that invested years ago already fought through the transition. Those starting later face tougher politics, weaker buy-in, and higher failure rates.
Strategic flexibility narrows. Operationally strong firms compete across proprietary, growth, carve-out, and distressed deals. Firms without operators are confined to auctions—pure financial buyers with fewer levers. Over time, their strategy shrinks to the least attractive opportunities, amplifying cyclicality risk.
The middle tier gets crushed. Mega-funds can compete on scale; operationally sophisticated mid-market funds compete on value-add. Firms caught in between—neither financial juggernauts nor operational leaders—face permanent decline. Once LPs categorize a firm as “undifferentiated,” the brand rarely recovers.
Crisis-driven builds fail. Investing now allows for deliberate recruitment, tool development, and integration. Waiting until fundraising failures or portfolio underperformance forces the issue means rushed hiring, overpaying for mediocre talent, and implementing under duress. Capabilities built in panic lack the quality and durability of those built with foresight.
The choice is stark: invest deliberately now, or watch competitors compound advantages until the gap becomes impossible to close.
The Choice and Its Consequences
The financial case for operating team investment is unambiguous. Firms with sophisticated operating capabilities deliver 2–3 percentage points higher IRR, creating hundreds of millions in additional value on a typical fund. The cost—5–20% of management fees—generates 2–5x ROI before even factoring in advantages in fundraising, deal flow, and talent. No other use of capital comes close.
But intellectual consensus doesn’t guarantee action. Resistance comes from partner economics, cultural friction, and the fact that results take years to show. Too often, firms fall into the “middle ground”: hiring token operating partners, talking up operational focus to LPs, but failing to empower or integrate them. The result is wasted resources, disappointed LPs, and underperforming portfolios.
Every firm faces a binary choice. Either fully commit to building world-class operating capabilities—or accept permanent competitive disadvantage. There is no halfway.
For firms that commit, the playbook is clear:
- Secure senior partner sponsorship, even at the cost of near-term cash reductions.
- Phase investment over 2–3 years, starting with pilots that prove ROI.
- Recruit exceptional operators with true partnership economics.
- Embed them across the deal lifecycle—from diligence through exit.
- Institutionalize operational excellence with repeatable processes.
- Measure and communicate impact to keep internal and LP confidence high.
For firms unwilling to invest at scale, honesty is the best strategy. Focus where operational demands are lighter, partner with firms that bring operating depth, or rely on networks of advisors. What’s fatal is claiming operating sophistication without backing it up—LPs see through it, and portfolios suffer.
Private equity is undergoing its most fundamental shift since the 1980s. The firms that began building operating capabilities decades ago—KKR, Blackstone, Bain, Apollo, Vista—now dominate the industry. The firms making bold commitments today will own the next decade. Those waiting for a “better time” are writing their obituaries in slow motion.
The economics justify it. The strategy requires it. The market punishes delay. The only question left is whether your firm has the conviction to act.