
Sector Specialist vs. Generalist Operating Models in Private Equity
Performance Superiority of Specialists is Quantifiable, But Scaling Reveals Trade-Offs
Sector-specialist private equity firms consistently outperform generalists by 340–940 bps in IRR, delivering 23.2% vs. 17.5% for generalists over 2001–2010 vintages (Cambridge Associates). Yet scale remains constrained: 70% of specialists manage $750M or less (Cambridge Associates).The choice between specialist and generalist models is not tactical—it defines firm economics, talent strategy, and long-term competitiveness.
The Quantitative Case for Sector Specialization
Cambridge Associates’ landmark study of 717 specialist investments ($33 billion deployed) versus 3,013 generalist investments ($252 billion deployed) across 2001–2010 vintages revealed a consistent edge for specialists. They achieved a 2.2x gross MOIC compared to 1.9x for generalists, with the advantage holding across all four sectors examined (Cambridge Associates). In financial services, the gap was dramatic: specialists generated a 23.3% IRR versus 13.9%for generalists—a 940 basis point spread (Cambridge Associates).
This outperformance has persisted. A Commonfund analysis of 2006–2020 vintages found specialists posted a 1.81x median TVPI versus 1.69x for generalists, outperforming in 13 of 15 vintage years. Specialists also beat public markets by 2.3% annualized compared to just 1.3% for generalists (Commonfund).
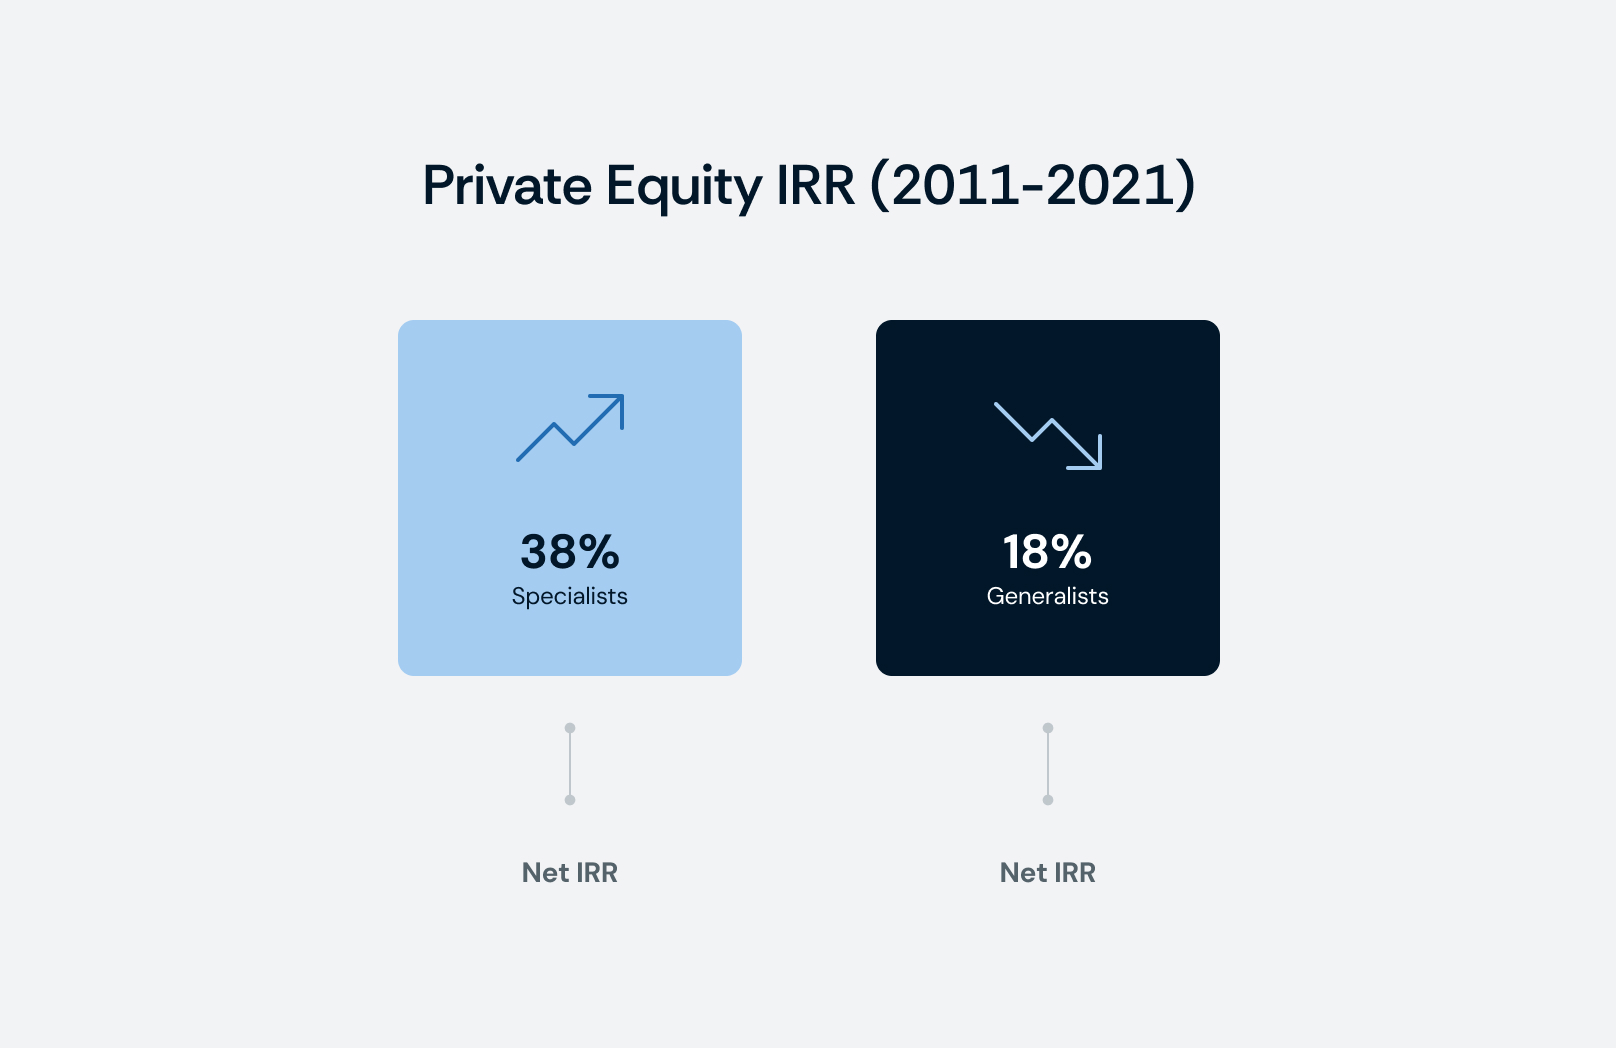
Even more striking, Mantra Investment Partners’ niche PE index reported that from 2011–2021, specialists achieved 38% net IRR compared to just 18% for the PitchBook generalist average (Mlcam). That represents a 20-point gap—or 111% higher returns.
The edge isn’t just upside capture. Specialists also show better downside protection. Only 14–25% of specialist capital produced sub-1.0x returns, compared to 28–31% for generalists. On the upside, 40–52% of specialist investments exceeded 2.0x multiples, versus 35–40% for generalists (Cambridge Associates). This dual advantage—fewer losses and bigger wins—challenges the assumption that concentration risk makes specialization more volatile.
The Economics of Building Sector Teams
- A dedicated operating partner costs $750K annually, rising to $2.2–3M including carry (Growth Equity Interview Guide). To earn ROI, they must drive 5–8% return uplift across 6–10 companies.
- Thresholds: 8–12 deals annually for lower middle market, 5–8 for mid-market, 3–5 for large-cap (Commonfund). Example: 5 deals × $50M = $250M deployed; 3% return improvement = $7.5M vs. $2M team costs = 2.75x ROI.
- Scaling to 5 operating partners requires $3–5B in fund size, 15–25 portfolio companies, and 8–15 new deals per year. Costs = $4.5M annually, just 5.6% of management fees on a $4B fund—easily covered by returns.
Case examples:
- Vista Equity Partners maintains a 1:1 ops-to-investment ratio, with ~100 Vista Consulting Group (VCG) staff supporting 85 companies (Umbrex).
- HGGC runs leaner, with 5–10 ops partners for $8B AUM.
- KKR Capstone deploys ~100 ops professionals across hundreds of companies in multiple sectors.
Vista: Industrializing Software Value Creation
Vista has built a 25-year, 600+ deal operating system purpose-built for software (GrowthCap). VCG’s 100+ specialists cover sales, product, engineering, finance, IT, and cybersecurity (Vista Equity Partners; Umbrex).
Impact:
- Sales pipelines: +15x
- Customer satisfaction: 86% → 90%
- R&D output: 2–3x
- EBITDA margins: up to 60%+ (Umbrex)
- 2024 AI initiatives cut dev costs by 95%, reduced support resolution times by 34%, and boosted funnel conversions by 60% (Vista Equity Partners).
Results: Vista funds achieved 37.4% gross IRR across 51 realized deals with 3.12x MOIC (New Jersey Treasury). Example: Marketo (acquired for $1.8B in 2016, sold to Adobe for $4.75B in 2018) doubled value in 24 months (AdExchanger; Constellation Research).
Vista’s systematized playbooks, training (Vista University), and alumni network create institutionalized operational edge few can replicate (Umbrex).
HGGC, Thoma Bravo, Francisco Partners: Alternative Specialist Models
- HGGC: Focuses on tech-enabled services with flexible ops group (5–10 partners). Emphasizes founder reinvestment and alignment (HGGC). Key exits: Hybris (sold to SAP), Sunquest (sold for $1.415B), AMI firmware (sold to THL) (Wikipedia).
- Thoma Bravo: $184B AUM, 555+ software deals worth $285B (Wikipedia). Runs multi-fund model (Flagship, Discover, Explore) to cover large, mid, and lower mid-market (Qubit)【+3】. 25+ ops partners, mostly ex-CEOs and CTOs (Umbrex).
- Francisco Partners: $50B raised, 450+ tech deals since 1999 (Wikipedia; Tracxn). Ops bench = 40+ ex-CEOs, including Red Hat, Veritas, and Inphi (Francisco Partners). Ranked #1 globally in performance five years running (Business Wire).
These firms show specialization comes in different flavors—Vista’s industrialization, HGGC’s leaner alignment-driven model, Thoma Bravo’s segmentation, and Francisco’s verticalized expertise.
Generalist Mega-Funds: Hybrid Sophistication
Mega-funds like KKR, Blackstone, and Apollo (collectively $2.6T AUM) run hybrid operating modelsbalancing scale with specialist capability.
- KKR Capstone (founded 2000) combines generalists with functional experts. Programs delivered $700M in procurement savings and $1.2B eco-efficiency gains (Umbrex). Case: Oriental Brewery grew EBITDA 2.3x, sold for $5.8B (Umbrex).
- Blackstone: Ops team supports 250+ companies with functional excellence in healthcare, procurement (~$600M savings), AI/digital, and talent (Blackstone).
- Apollo: APPS launched 2020 with ~35 ops partners focusing on digital, AI, supply chain, and sustainability. Apollo’s insurance-driven capital model provides permanent capital flexibility (Fortune; Yahoo Finance).
Key insight: Generalists don’t match specialists on raw returns but win through scale economics, diversified deal flow, and functional leverage (Commonfund).